About TableBench
TableBench is a comprehensive and complex
benchmark designed to evaluate Table
Question Answering (TableQA) capabilities, aligning closely with the "Reasoning Complexity of
Questions" dimension in real-world Table QA scenarios. It covers 18 question
categories
across 4 major ategories—including Fact Checking, Numerical Reasoning, Data
Analysis, and Visualization—with 886 carefully curated test cases. TableBench
substantially pushes the boundaries of large language models in complex TableQA scenarios.
News
-
Apr. 18, 2025:
🔥🔥 We have released a cleaner version of
TableBench. Please download the updated version of TableBench again. We have thoroughly reviewed all test set cases and fixed any errors we found.🚀🚀
Brand new Leaderboard: We've included the performance of many newly released models in our latest leaderboard and will continue to keep it up to date. Submissions are welcome! For submission guidelines, please refer to the Submission section.🔍🔍
Refined Evaluation Metrics: In response to community feedback and in-depth discussions, we've updated the evaluation metrics for Fact Checking, Numerical Reasoning, and Data Analysis. You can find the detailed specifications of these new metrics and evaluation tools on our github repo.Thank you for all the feedback!!!
-
Jan. 21, 2025: We are thrilled to share that
our paper has been
accepted to
AAAI 2025! We sincerely thank our co-authors, the anonymous reviewers, and all the researchers and users on GitHub or through email whose valuable feedback and support have greatly contributed to this work." -
Aug. 29, 2024: We officially released the
TableBench
and TableInstruct
dataset on huggingface!
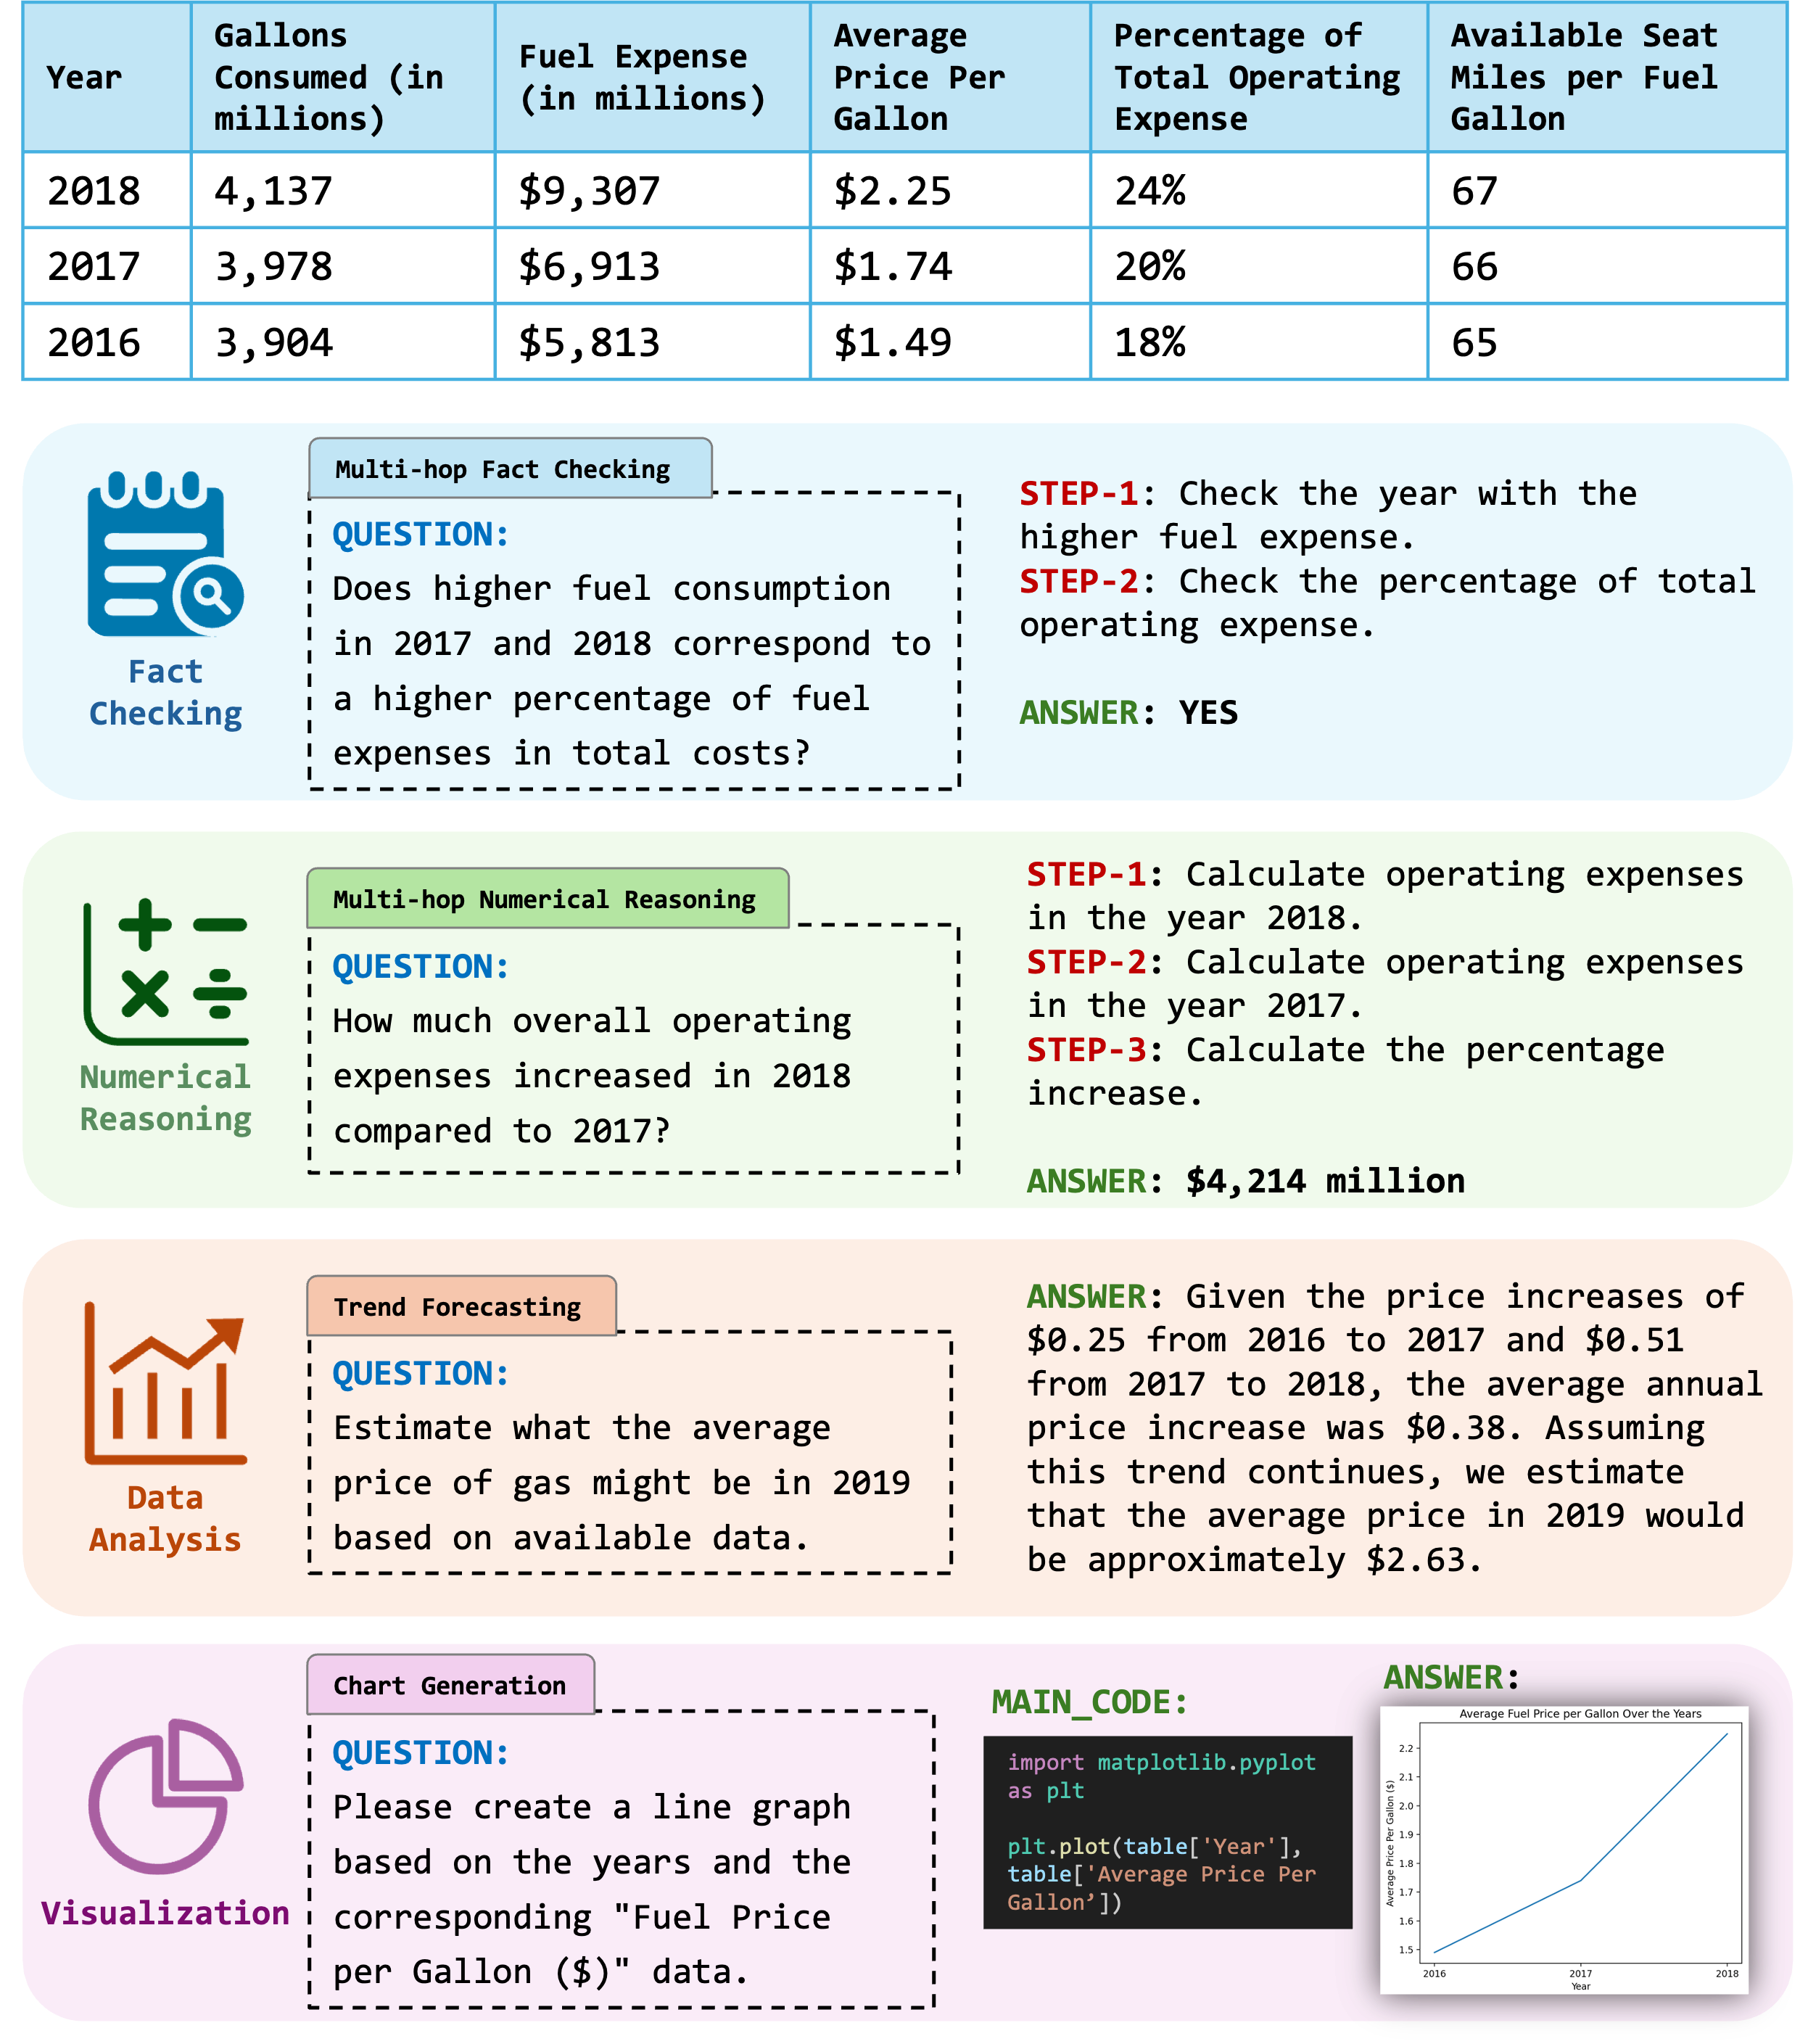
TableBenchfocuses on the reasoning complexity of questions, covering a wide range of reasoning types across 4 major categories—Fact Checking,Numerical Reasoning,Data Analysis, andVisualization—with a total of 18 fine-grained subcategories. The dataset consists of 886 carefully constructed test instances.
Challenges from TableBench
1. Multi-hop fact-checking involves multiple steps to establish the relationship between facts across information from table.
2. Multi-hop numerical reasoning involves calculating the intermediate results of multiple steps based on the data in the table to achieve the final conclusion.
3. Trend forecasting involves estimating future data trends based on historical data analysis.
4. Chart generation necessitates executing program commands to create charts.
Submission
🤗🤗 We warmly welcome submissions to our leaderboard, including both your own methods and contributions
showcasing the latest model performance! TableBench features two separate leaderboards. Please refer to
the Submission Guidelines below for details, and submit your results as instructed to
tablebench2025@gmail.com.
Citation
@inproceedings{wu2025tablebench,
  title={Tablebench: A comprehensive and complex benchmark for table question answering},
  author={Wu, Xianjie and Yang, Jian and Chai, Linzheng and Zhang, Ge and Liu, Jiaheng and Du, Xeron and Liang, Di and Shu, Daixin and Cheng, Xianfu and Sun, Tianzhen and others},
  booktitle={Proceedings of the AAAI Conference on Artificial Intelligence},
  volume={39},
  number={24},
  pages={25497--25506},
  year={2025}
}
| Model |
FC |
NR |
DA |
VIZ |
Overall | |
|---|---|---|---|---|---|---|
|
Human Performance |
85.91 | |||||
| Oct 14, 2025 | RankAgent Meta |
87.5 | 78.34 | 45.3 | 50.0 | 62.14 |
| Apr 16, 2025 | o4-mini-high + DP baseline |
82.29 | 81.11 | 42.3 | 54.0 | 61.69 |
| Apr 16, 2025 | o4-mini + DP baseline |
83.33 | 80.35 | 40.5 | 50.0 | 60.75 |
| Aug 07, 2025 | GPT-5 + DP baseline |
83.33 | 82.37 | 36.04 | 58.0 | 59.94 |
| Jan 31, 2025 | o3-mini + DP baseline |
86.46 | 82.07 | 35.56 | 32.0 | 59.90 |
| Jul 09, 2025 | Grok4 + DP baseline |
83.33 | 73.8 | 40.54 | 16.0 | 57.80 |
| Jun 17, 2025 | Gemini-2.5-Pro + DP baseline |
84.38 | 79.6 | 31.86 | 66.0 | 57.18 |
| Jan 20, 2025 | Deepseek-R1 + DP baseline |
82.29 | 75.51 | 35.06 | 20.0 | 56.31 |
| May 22, 2025 | Claude4-Sonnet + DP baseline |
81.25 | 75.57 | 31.14 | 54.0 | 54.75 |
| Apr 05, 2025 | Llama-4-Maverick-17B-128E-Instruct + TCoT baseline |
80.21 | 73.3 | 28.84 | 54.0 | 52.73 |
| Apr 29, 2025 | Qwen3-32B baseline |
83.33 | 72.54 | 28.16 | 18.0 | 52.45 |
| May 13, 2024 | GPT-4o + TCoT baseline |
81.25 | 68.51 | 32.09 | 56.0 | 51.96 |
| Apr 09, 2024 | GPT-4-Turbo + TCoT baseline |
86.46 | 66.25 | 32.07 | 62.0 | 51.5 |
| Mar 25, 2025 | Deepseek-Chat-V3 + TCoT baseline |
82.29 | 69.27 | 27.32 | 48.0 | 50.56 |
| Jul 23, 2024 | Llama-3.1-405B-Instruct + TCoT baseline |
78.12 | 64.99 | 29.11 | 32.0 | 48.87 |
| Sep 19, 2024 | Qwen2.5-72B-Instruct + TCoT baseline |
80.21 | 64.48 | 28.89 | 34.0 | 48.79 |
| Apr 05, 2025 | Llama-4-Scout-17B-16E-Instruct + TCoT baseline |
81.25 | 64.23 | 23.07 | 30.0 | 46.53 |
| Nov 12, 2024 | Qwen2.5-Coder-32B-Instruct + TCoT baseline |
84.38 | 57.68 | 27.14 | 32.0 | 45.51 |
| Mar 06, 2025 | QWQ-32B + DP baseline |
81.25 | 59.7 | 21.45 | 12.0 | 43.87 |
| Jul 23, 2024 | Llama3.1-70B-Instruct + TCoT baseline |
70.83 | 53.15 | 24.66 | 26.0 | 41.05 |
| Nov 4, 2024 | TableGPT2-7B + TCoT [Su et al. '24] |
75.0 | 51.39 | 25.53 | 28.0 | 41.05 |
| Apr 13, 2024 | Llama3-70B-Chat + TCoT baseline |
70.83 | 43.58 | 29.66 | 4.0 | 38.68 |
| Jan 25, 2024 | GPT-3.5-Turbo + PoT baseline |
58.33 | 47.86 | 24.19 | 38.0 | 37.15 |
| Nov 12, 2024 | Qwen2.5-Coder-7B-Instruct + TCoT baseline |
71.88 | 40.05 | 24.23 | 6.0 | 35.12 |
| Aug 13, 2024 | TableLLM-Qwen2-7B + TCoT [Wu et al. '24] |
60.42 | 36.52 | 23.19 | 24.0 | 31.9 |
| Aug 13, 2024 | TableLLM-Llama3.1-8B + TCoT [Wu et al. '24] |
69.79 | 30.73 | 24.34 | 24.0 | 30.77 |
| Aug 13, 2024 | TableLLM-DeepseekCoder-7B + TCoT [Wu et al. '24] |
63.54 | 34.26 | 21.33 | 36.0 | 30.51 |
| Aug 13, 2024 | TableLLM-Llama3-8B + TCoT [Wu et al. '24] |
64.58 | 30.48 | 23.57 | 26.0 | 29.8 |
| Aug 13, 2024 | TableLLM-CodeQwen-7B + TCoT [Wu et al. '24] |
57.29 | 22.17 | 22.34 | 36.0 | 24.81 |
| Apr 13, 2024 | Llama3-8B-Chat + SCoT baseline |
65.62 | 14.61 | 22.06 | 0.0 | 22.2 |
| Sep 19, 2024 | Qwen2.5-7B-Instruct + TCoT baseline |
60.42 | 16.88 | 20.73 | 6.0 | 22.14 |
| Dec 11, 2023 | Mixtral-8x7B-Instruct + PoT baseline |
31.25 | 30.48 | 12.01 | 6.0 | 21.7 |
| Jul 23, 2024 | Llama3.1-8B-Instruct + DP baseline |
54.17 | 7.3 | 16.2 | 2.0 | 15.42 |
| Sep 27, 2023 | Mistral-7B-Instruct + SCoT baseline |
36.46 | 4.53 | 12.89 | 0.0 | 10.97 |
| Model |
Size |
DP |
TCoT |
SCoT |
PoT | |
|---|---|---|---|---|---|---|
| Apr 16, 2025 | o4-mini-high 🤔 (2025-04-16) OpenAI |
UNK |
61.69 | - | - | - |
| Apr 16, 2025 | o4-mini 🤔 (2025-04-16) OpenAI |
UNK |
60.75 | - | - | - |
| Aug 07, 2025 | GPT-5 (2025-08-07) OpenAI |
UNK |
59.94 | - | - | - |
| Jan 31, 2025 | o3-mini 🤔 (2025-01-31) OpenAI |
UNK |
59.90 | - | - | - |
| Jul 09, 2025 | Grok4 xAI |
314B |
57.80 | - | - | - |
| Jun 17, 2025 | Gemini-2.5-Pro (2025-06-17) Google |
UNK |
57.18 | - | - | - |
| Jan 20, 2025 | Deepseek-R1 🤔 (2025-01-20) Deepseek |
685B |
56.31 | - | - | - |
| May 22, 2025 | Claude4-Sonnet Anthropic |
UNK |
54.75 | - | - | - |
| Apr 05, 2025 | Llama-4-Maverick-17B-128E-Instruct Meta AI |
402B |
49.49 | 52.73 | 41.92 | 34.3 |
| Apr 29, 2025 | Qwen3-32B (2025-04-29) Alibaba |
UNK |
52.45 | - | - | - |
| May 13, 2024 | GPT-4o (2024-05-13) OpenAI |
UNK |
40.91 | 51.96 | 41.43 | 45.71 |
| Apr 09, 2024 | GPT-4-Turbo (2024-04-09) OpenAI |
UNK |
38.74 | 51.5 | 42.27 | 48.49 |
| Mar 25, 2025 | Deepseek-Chat-V3 (2025-03-24) Deepseek |
685B |
36.99 | 50.56 | 45.99 | 45.54 |
| Jul 23, 2024 | Llama-3.1-405B-Instruct Meta AI |
405B |
36.04 | 48.87 | 39.85 | 26.21 |
| Sep 19, 2024 | Qwen2.5-72B-Instruct Alibaba |
72B |
27.5 | 48.79 | 35.99 | 42.4 | Apr 05, 2025 | Llama-4-Scout-17B-16E-Instruct Meta AI |
109B |
44.93 | 46.53 | 35.52 | 17.42 |
| Nov 12, 2024 | Qwen2.5-Coder-32B-Instruct Alibaba |
32B |
26.98 | 45.51 | 30.17 | 38.72 |
| Mar 06, 2025 | QWQ-32B 🤔 Alibaba |
32B |
43.87 | 43.48 | 37.06 | 31.58 |
| Jul 23, 2024 | Llama3.1-70B-Instruct Meta AI |
70B |
30.02 | 41.05 | 38.12 | 30.1 |
| Nov 4, 2025 | TableGPT2-7B [Su et al. '24] |
7B |
27.95 | 41.05 | 31.4 | 38.67 |
| Apr 13, 2024 | Llama3-70B-Instruct Meta AI |
70B |
28.5 | 38.68 | 31.12 | 34.77 |
| Jan 25, 2024 | GPT-3.5-Turbo (2024-01-25) OpenAI |
UNK |
24.05 | 26.83 | 26.8 | 37.15 |
| Nov 12, 2024 | Qwen2.5-Coder-7B-Instruct Alibaba |
32B |
21.6 | 35.12 | 22.12 | 16.46 |
| Aug 13, 2024 | TableLLM-Qwen2-7B [Wu et al. '24] |
7B |
22.29 | 31.9 | 23.62 | 12.87 |
| Aug 13, 2024 | TableLLM-Llama3.1-8B [Wu et al. '24] |
8B |
22.3 | 30.77 | 21.92 | 27.17 |
| Aug 13, 2024 | TableLLM-DeepseekCoder-7B [Wu et al. '24] |
7B |
23.15 | 30.51 | 23.56 | 18.74 |
| Aug 13, 2024 | TableLLM-Llama3-8B [Wu et al. '24] |
8B |
20.78 | 29.8 | 20.78 | 14.75 |
| Aug 13, 2024 | TableLLM-CodeQwen-7B [Wu et al. '24] |
7B |
20.15 | 24.81 | 20.55 | 15.14 |
| Apr 13, 2024 | Llama3-8B-Instruct Meta AI |
8B |
21.32 | 19.9 | 22.2 | 14.51 |
| Sep 19, 2024 | Qwen2.5-7B-Instruct Alibaba |
7B |
17.63 | 22.14 | 21.32 | 21.86 |
| Dec 11, 2023 | Mixtral-8x7B-Instruct-v0.1 Mistral AI |
56B |
17.38 | 16.56 | 18.04 | 21.7 |
| Jul 23, 2024 | Llama3.1-8B-Instruct Meta AI |
8B |
15.42 | 12.78 | 13.53 | 14.18 |
| Sep 27, 2023 | Mistral-7B-Instruct-v0.2 Mistral AI |
7B |
10.8 | 10.77 | 10.97 | 2.53 |